Trading strategies in financial markets often rely on various tools. Even within technical analysis, the options are vast. Some traders prefer flat market strategies, others use trading robots or complex indicators. However, a significant number focus on visual analysis using Japanese candlesticks.
This article delves into how these candlesticks can signal the beginning or end of a trend.
Article content
Why Are Japanese Candlesticks So Popular?
Japanese candlesticks are highly regarded for the wealth of information they offer. Each candlestick reveals:
- The direction of price movement,
- The opening and closing prices during the selected time frame,
- The highest and lowest prices reached during this period.
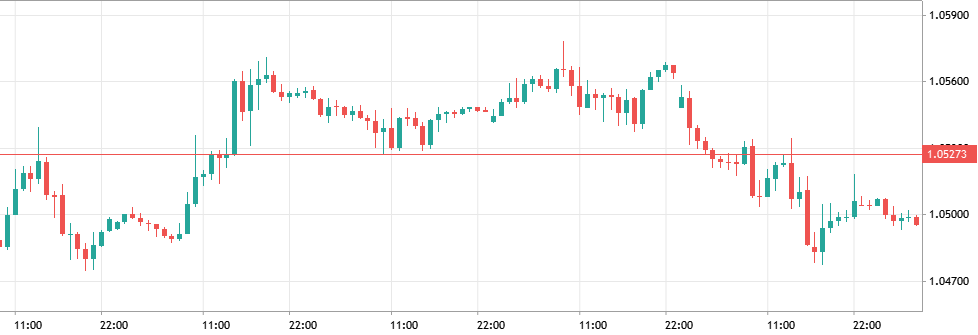
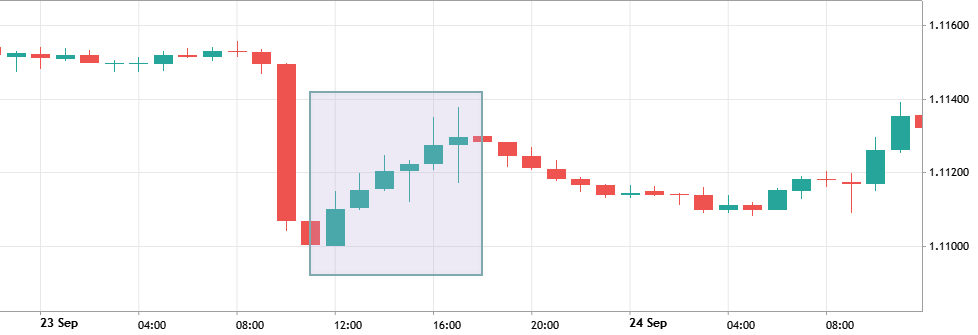
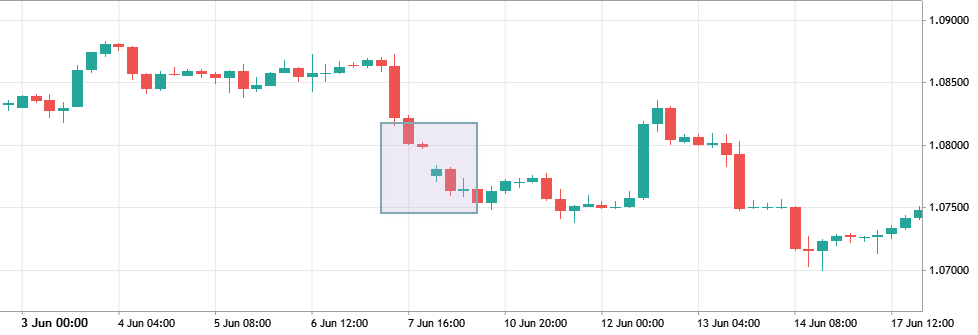
By analyzing how candlesticks relate to one another, traders can identify trends. Here are a few examples in one image:
While spotting a trend is relatively simple, recognizing its beginning is more challenging. Fortunately, several candlestick patterns help predict reversals or new trends.
Key Candlestick Patterns for Identifying Trends
The Hammer and Its Variations
The “hammer” is one of the most recognizable patterns, involving just one candlestick. A typical hammer features:
- A small body near the top,
- A shadow at least twice the size of the body,
- Formation after a downtrend.
An inverted hammer, also following a downtrend, has a small body at the bottom of the candlestick.
Both patterns are considered bullish, signaling the market is entering a buyer’s zone. On the flip side, when these candlesticks follow an uptrend, they are known as the “shooting star” and “hanging man,” indicating a potential bearish reversal.
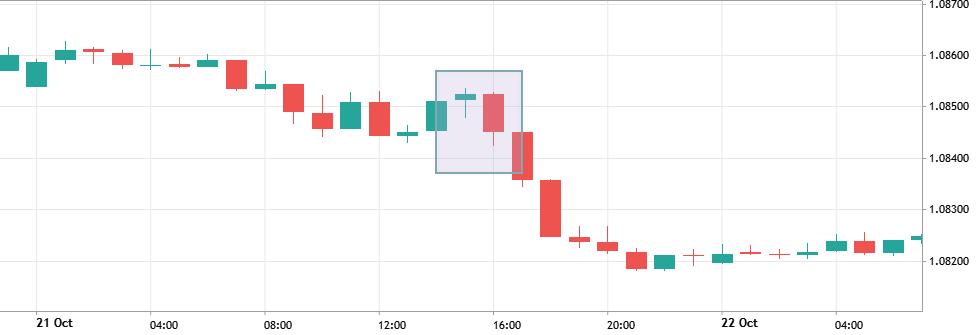
Engulfing Pattern
The engulfing pattern, though less common, is highly reliable. It occurs when one candlestick entirely covers the range of the previous one, moving in the opposite direction. This pattern can be bullish or bearish, depending on the trend reversal it predicts.
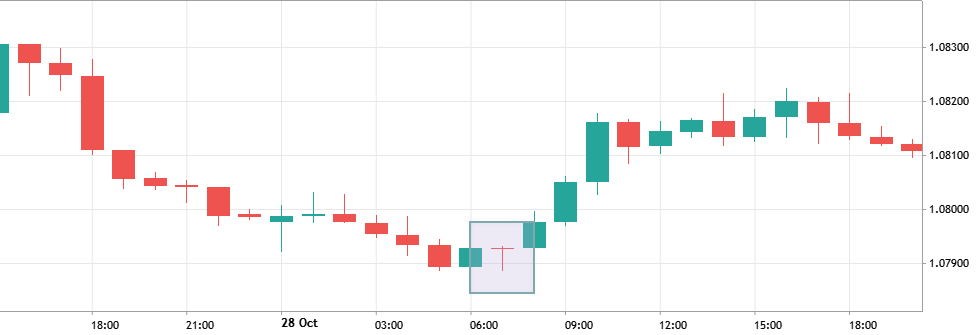
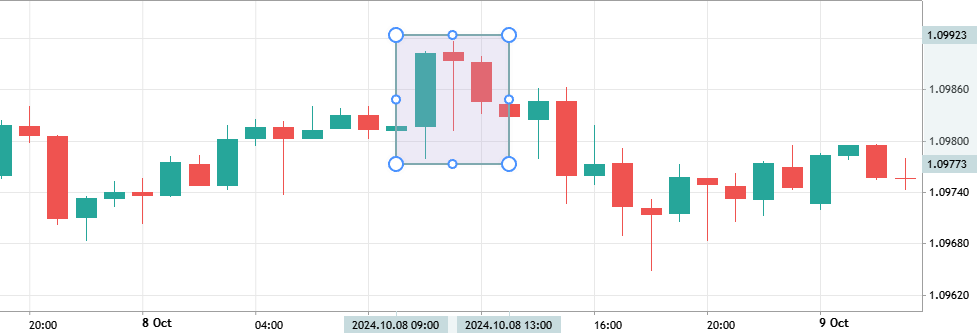
Morning and Evening Stars
The two “star” patterns are mirror images of each other. The “morning star” signals the likely start of an upward trend, while the “evening star” suggests the onset of a downward trend. These patterns are somewhat similar to the “engulfing” pattern, but the “star” requires three candlesticks. In this formation, the rightmost candlestick fully or partially engulfs the leftmost one, with a “doji” positioned in the middle – a candlestick characterized by a very small or absent body and long shadows.
These patterns help traders identify the beginning of a new trend with a relatively high degree of confidence. However, entering a trade at the right time is only half the challenge. Successfully exiting the trade with a profit is equally important, and this can be guided by other patterns that signal a potential end to the trend.
Identifying Trend Weakness and Reversal
Recognizing when a trend is losing momentum is crucial for timely exits. Here are some signs:
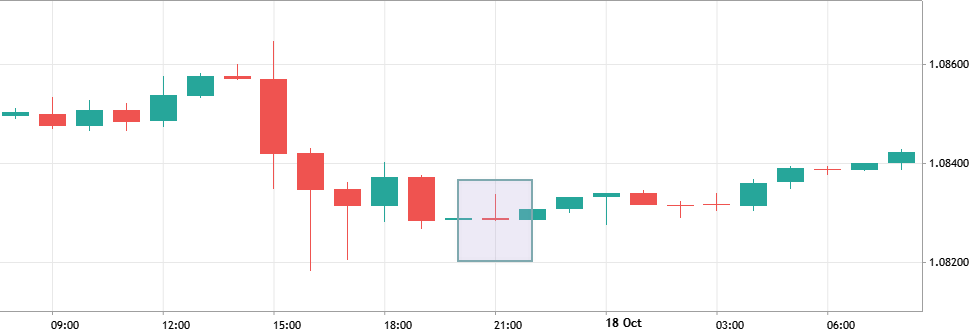
Shrinking Candlestick Bodies
As a trend weakens, candlesticks often become smaller. A series of diminishing bodies (each smaller than the previous one) suggests a lack of market interest. A doji appearing in such sequences increases the likelihood of reversal or consolidation.
Lengthening Shadows
In an uptrend, a long upper shadow signals profit-taking by buyers, often leading to a correction. Similarly, during a downtrend, a long lower shadow indicates active buying, suggesting the decline might be nearing its end.
Challenges in Interpreting Candlestick Patterns
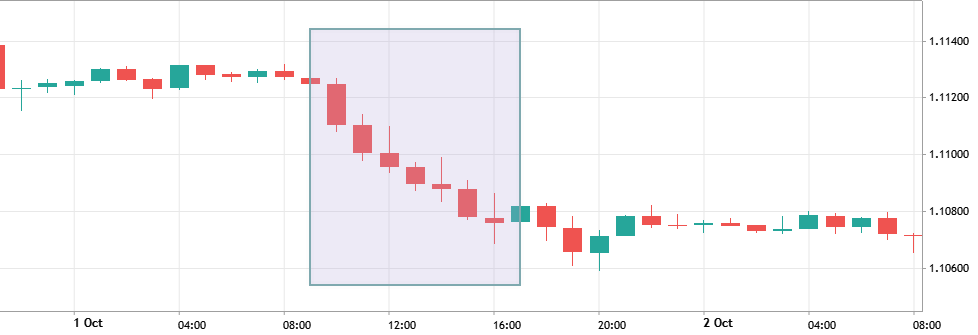
A price gap in the direction of the trend often precedes its conclusion. In many cases, the price retraces to the previous range, confirming a sentiment shift. However, trading gaps can be risky, so proceed cautiously.
Challenges in Interpreting Candlestick Patterns
While candlestick patterns are a valuable tool for traders, they are not without limitations. Several challenges can complicate their interpretation:
- Ambiguity. Candlestick patterns can indicate a reversal, continuation, or have no significance at all. It’s crucial to confirm any conclusions with additional tools or data to avoid acting on false signals.
- Overlapping Patterns. Charts can sometimes display multiple patterns at the same time, often with conflicting implications. This can confuse even experienced traders and highlights the complexity of market behavior. Even the most advanced algorithms in investment firms cannot account for every variable.
- Fundamental Factors. Patterns that seem clear can be disrupted by unexpected news events, economic releases, or geopolitical developments, which may create entirely new trends.
Conclusion
Although candlestick patterns offer valuable insights, they are not a standalone solution for successful trading. To use them effectively, traders must adopt a comprehensive approach that combines risk management and diverse analytical tools.
Essential Rules for Trading with Candlesticks:
- Manage Risk. Always diversify your portfolio, limit leverage, and set stop-loss orders to protect against unexpected market movements.
- Use Multiple Tools. Enhance candlestick analysis by incorporating other technical indicators and fundamental data. A balanced approach reduces the likelihood of overreliance on any single method.
- Stay Informed. Be aware of current market conditions, news, and economic events that could impact the accuracy of candlestick signals.
By mastering Japanese candlestick analysis and applying these principles, novice traders can gain a clearer understanding of market dynamics, make informed decisions, and improve their chances of success. Remember, consistent learning, disciplined practice, and adaptability are the cornerstones of thriving in the ever-evolving world of financial markets.