
Technical analysis patterns help traders identify potential price reversals or continuations, making them an essential tool for decision-making in the Forex market. One such pattern, the ‘diamond’ pattern, is relatively rare but highly valuable when recognized and interpreted correctly.
In this article, we’ll explore its structure, how to identify it, and trading strategies that can help you capitalize on it.
Article content
What is the ‘Diamond’ Pattern?
The ‘diamond’ pattern is primarily a reversal formation, though it can sometimes indicate trend continuation. It typically appears after a prolonged market trend and is formed by a sequence of expanding and contracting price ranges, creating a diamond shape on the chart.
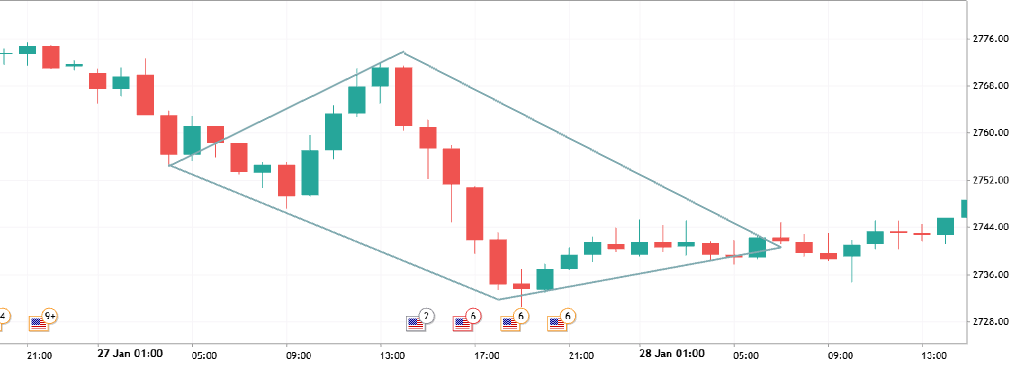
- When the pattern develops after an uptrend, it’s called a ‘diamond top’ and signals a potential bearish reversal.
- When it forms after a downtrend, it’s known as a ‘diamond bottom’, hinting at a possible bullish reversal.
The pattern reflects a temporary balance between buyers and sellers. Initially, volatility increases, forming higher highs and lower lows (for a top) or lower lows and higher highs (for a bottom). Eventually, this instability leads to a breakout, often resulting in a significant price movement.
How to Identify the ‘Diamond’ Pattern
The ‘diamond’ pattern is relatively rare, which can make it easier to spot when it does appear. Follow these key steps to identify it correctly:
- Recognizing the shape. The pattern consists of two phases: an initial expansion of price movement, where highs and lows widen, followed by a contraction, where price movements narrow. This creates a diamond-like shape on the chart.
- Assessing the trend. The pattern is most reliable when it forms after a strong uptrend or downtrend. If it appears during a sideways market, it may just be temporary price fluctuations caused by news events or increased volatility, rather than a true reversal signal.
- Confirming the pattern. To strengthen confidence in the setup, traders often look at trading volume – a breakout with rising volume supports the validity of the pattern. Additionally, technical tools like trendlines, moving averages, and Fibonacci retracements can help confirm the formation.
- Using additional indicators. Oscillators like RSI, MACD, and Stochastic can indicate whether an asset is overbought or oversold when the ‘diamond’ pattern appears. If price action diverges from these indicators, it may suggest a potential reversal.
By carefully following these steps, traders can improve their ability to recognize and act on the ‘diamond’ pattern effectively.

Trading Strategies Using the ‘Diamond’ Pattern
There are two primary ways to trade the ‘diamond’ pattern:
1. Breakout Strategy
This approach focuses on entering a trade once the price decisively moves beyond the narrowing part of the ‘diamond’ pattern.
- If the price breaks above the upper boundary of a ‘diamond bottom,’ traders typically enter a buy position after the breakout candle closes.
- If the price breaks below the lower boundary of a ‘diamond top,’ traders open a short position, anticipating a downtrend.
A strong breakout is often accompanied by increased volume, adding confirmation to the trade.
2. Reversal Strategy
This method assumes that after an initial breakout, the price may pull back to retest the pattern’s boundary before continuing in the breakout direction.
- Traders wait for the price to return to the breakout level (the former support/resistance line of the ‘diamond’).
- If the price shows signs of holding at this level, they enter a trade in the direction of the breakout.
This strategy helps traders avoid false breakouts and secure better entry points.
Risks and Considerations
- False breakouts. Not every breakout leads to a sustained move. Some breakouts fail and result in the price returning inside the pattern. To filter out false signals, traders should watch for confirmation from volume or additional indicators.
- Pattern rarity. Since the ‘diamond’ pattern is uncommon, traders may not get frequent opportunities to trade it. This makes patience and careful validation essential.
- Subjectivity. Different traders may interpret the pattern slightly differently, especially during volatile price swings. To minimize subjectivity, traders should use clear rules for drawing trendlines and apply supporting indicators.
- Risk management. A well-defined stop-loss and take-profit strategy is crucial. The pattern does not always reach its projected price target, so traders must calculate risk-reward ratios carefully.

Conclusion
The ‘diamond’ pattern is a unique and valuable technical analysis tool that helps traders identify potential trend reversals or continuations. While it is relatively rare, those who can recognize and interpret it correctly may uncover profitable trading opportunities. To trade this pattern successfully, it’s essential to:
- Accurately recognize the expanding and contracting phases.
- Use volume and technical indicators for confirmation.
- Develop a solid risk management plan.
By applying these principles, traders can integrate the ‘diamond’ pattern into their overall trading approach, enhancing their decision-making and improving consistency in their results.