The concept of Fibonacci numbers has fascinated people far beyond the world of trading. However, in the Forex market, these numbers hold particular significance for traders, especially those who rely on technical analysis. If you’re just starting your trading journey, understanding Fibonacci tools can be a game-changer. Interestingly, platforms like MetaTrader 5 offer six different tools named after the legendary Italian mathematician, Leonardo of Pisa, better known as Fibonacci.
But where do these tools come from, and how can you use them effectively in your trading strategy? Let’s explore.
Article content
What Are Fibonacci Numbers?
The story of Fibonacci numbers is a blend of math and myth. First, there was no individual named Fibonacci; it’s the nickname of Leonardo of Pisa, a 12th-century mathematician. Second, the term “Fibonacci numbers” was coined only about 150 years ago. Over the centuries, these numbers have been applied across various fields, from biology and art to financial markets.
For trading purposes, here’s what you need to know: Fibonacci numbers form a sequence where each number is the sum of the two preceding ones – 1, 1, 2, 3, 5, 8, 13, 21, and so on. More importantly, two key ratios emerge from this sequence:
- Dividing a larger number by the preceding one gives approximately 1.618 (the golden ratio).
- Dividing a smaller number by a larger one that is two places away gives about 0.382.
These ratios form the foundation of Fibonacci trading tools. Now, let’s look at how these tools work.
Fibonacci Tools Explained
Levels (Lines)
This is the most popular and widely recognized Fibonacci tool. As the name suggests, it consists of several parallel horizontal lines, with the spacing calculated based on the Fibonacci coefficients mentioned earlier.
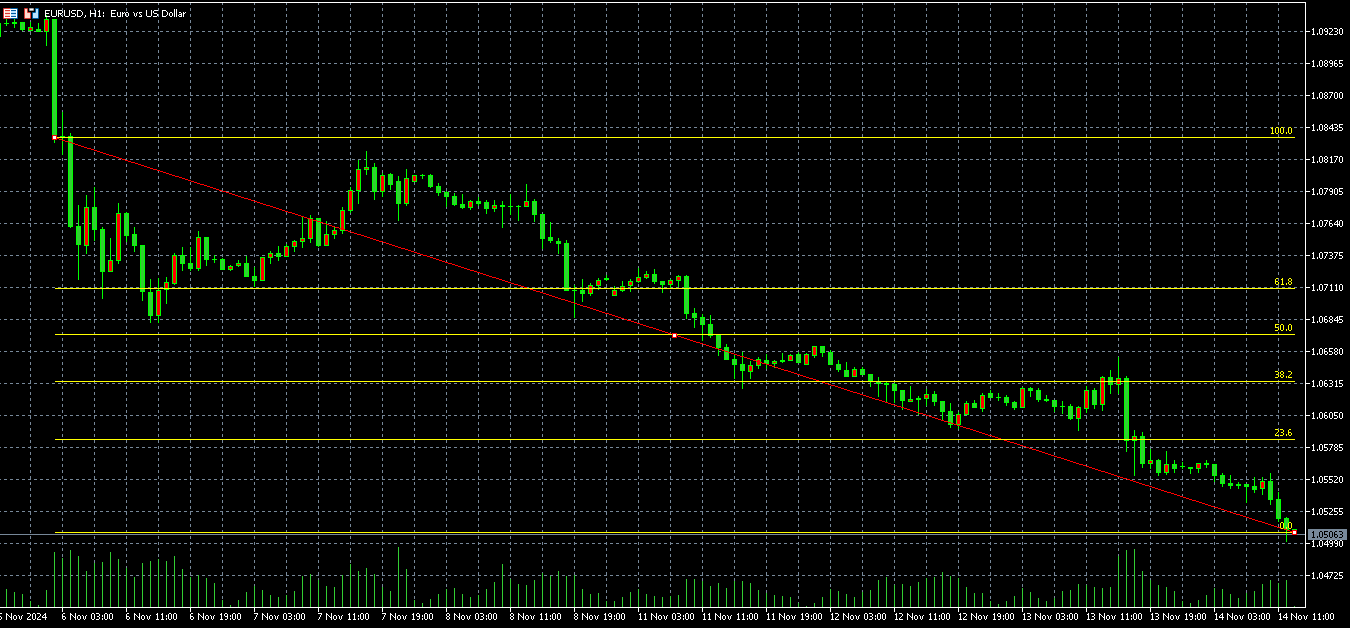
Like other Fibonacci tools, constructing levels is straightforward. Simply draw a line connecting the start and end points of the most recent visible trend. After that, you will see a grid of lines. It’s essential to note one key detail: in the image above, the bottom line coincides with the endpoint of the selected trend. The other levels represent potential reversal zones where the price often pauses or consolidates for a while. However, this indicator does not help predict how long the trend will last.
If you aim to trade with the trend rather than corrections, the line should be drawn from the end of the trend back to its beginning. This approach provides a different visual, as shown in the following image.
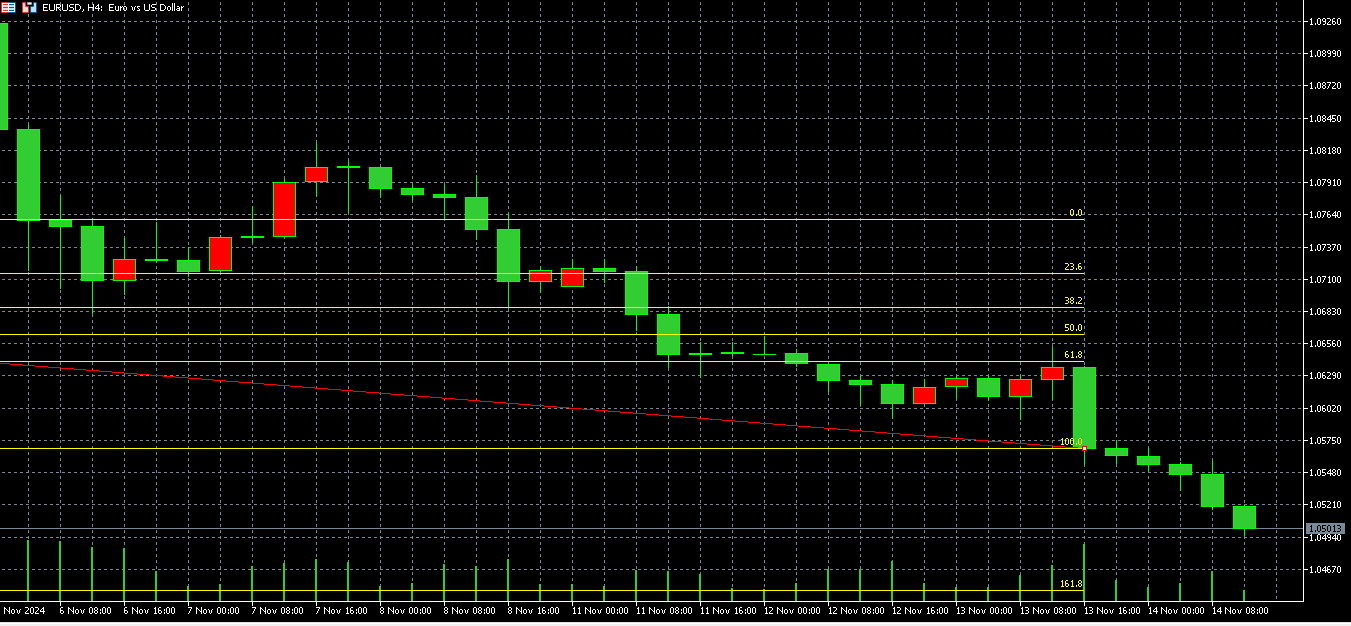
The outer level, ranging from 0 to 100, is often used as a target for placing Take Profit orders, while the internal levels are useful for setting Stop Loss orders. Additionally, you can explore breakout trading strategies by placing pending orders near these levels.
Time Zones
Fibonacci Time Zones are arguably the most debated tool in the Fibonacci set. Theoretically, they aim to forecast not the direction of price movement but the timing of future wave formations. Visually, this tool is represented by vertical lines.
Despite its intriguing concept, the effectiveness of Fibonacci Time Zones remains controversial. There are several reasons for this:
- Different currency pairs exhibit different cycle lengths, making it challenging to standardize the tool’s application.
- The outcome of the mathematical calculations can vary significantly depending on the chosen timeframe, leading to inconsistencies in predictions.
- The duration of a trend is often influenced by fundamental factors, which cannot be captured by this tool alone.
While the tool can provide insights, traders should approach its use with caution and combine it with other methods for a more comprehensive analysis.
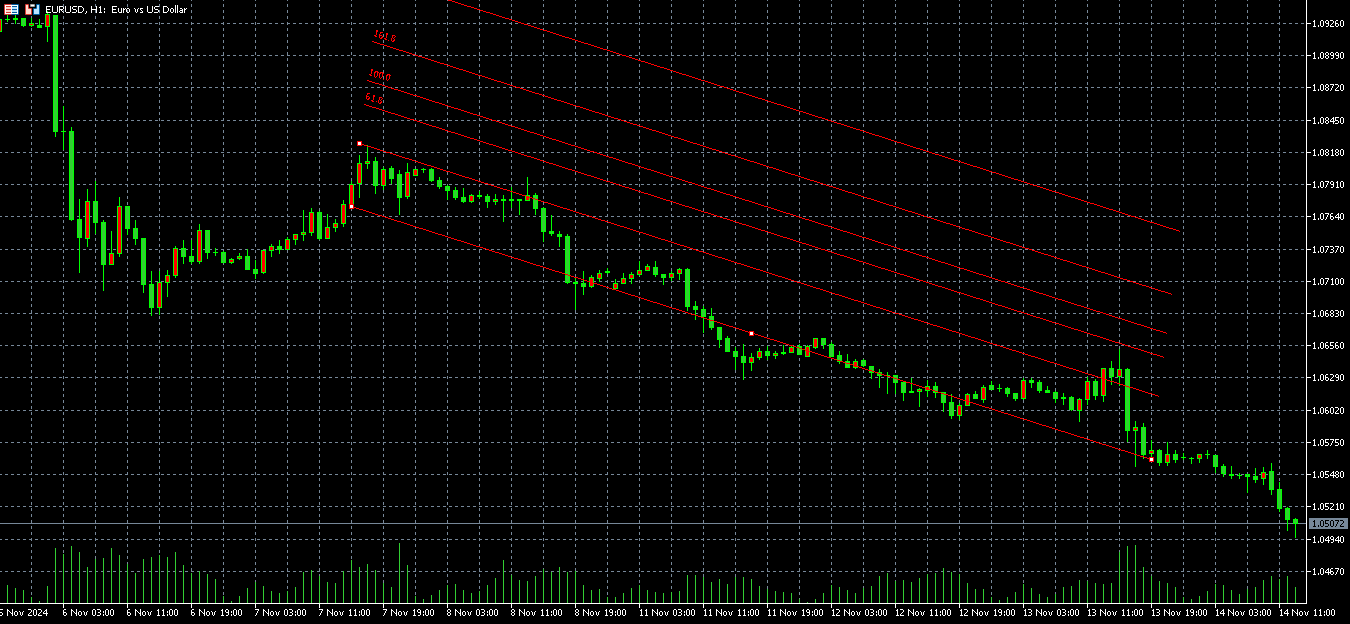
Channel
The Fibonacci Channel is an enhanced version of Fibonacci Levels with two key features that traders find valuable. First, its lines are inclined, meaning they align with the trend rather than being horizontal. Second, the second line is adjustable, allowing traders to create a tool that effectively highlights support and resistance levels.
Arcs
Fibonacci Arcs are another derivative tool, with varying opinions on how useful they are in practice.
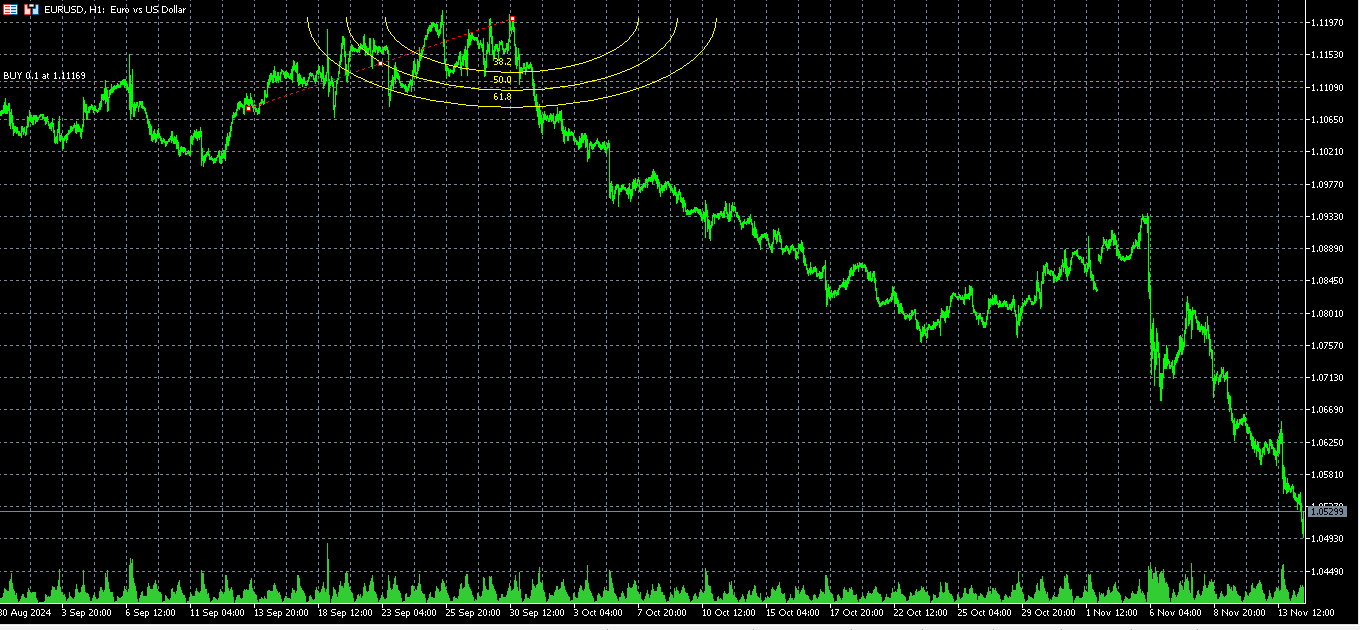
One of the most common views is that Fibonacci Arcs work best in flat markets. When configured correctly, they can help identify potential breakout points with a reasonable degree of accuracy.
Fan
A Fibonacci Fan consists of several diagonal rays that radiate outward from a central point.
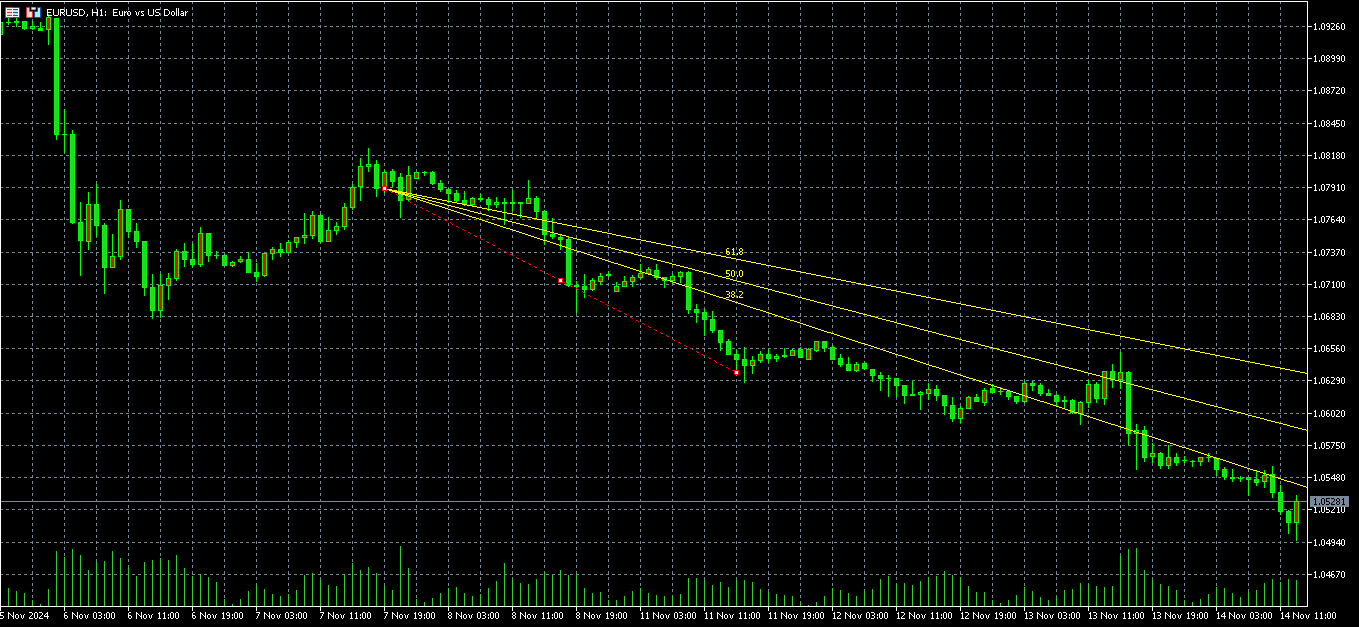
This tool is primarily used to determine correction levels. During a bearish trend, the rays are positioned above the chart, while in a bullish trend, they appear below.
Apart from trading on corrections, the Fibonacci Fan has another notable application—setting a dynamic Trailing Stop order. By aligning the order with one of the fan’s rays, traders can maximize profits while still safeguarding against unexpected trend reversals.
Extensions
Fibonacci Extensions are straightforward to understand once you see how they look.
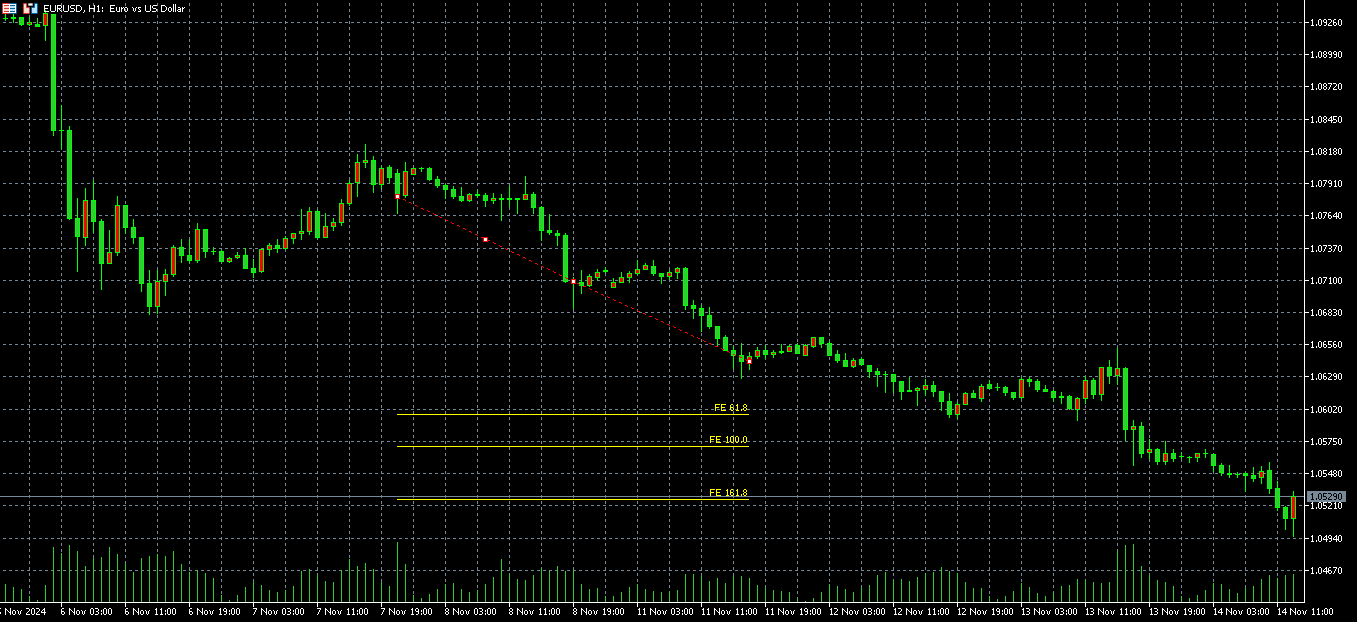
These extensions are primarily used for setting Take Profit levels. The tool offers three potential support and resistance lines, enabling traders to make more informed decisions based on their chosen strategy and personal risk tolerance.
Conclusion
Fibonacci tools are valuable allies for traders, whether you’re a novice or a seasoned investor. Each tool offers unique features, allowing you to analyze trends, predict reversals, or set profit and stop-loss levels. Experiment with different strategies and timeframes to discover how each tool fits into your trading style. Always prioritize risk management to protect your capital and optimize long-term gains. With a solid understanding of Fibonacci tools, you’ll be better equipped to navigate the dynamic world of Forex trading.