
Traders use many tools to understand market trends, and one popular tool is the Commodity Channel Index (CCI). Don’t let the name fool you – the CCI isn’t just for commodities. You can use it to analyze currencies, stocks, indices, and more.
In this article, we’ll explain how the CCI works, the important signals it gives, and simple strategies to use with it.
Article content
What Is the CCI and How Does It Work?
The CCI is an oscillator that measures the extent to which an asset’s price deviates from its average over a defined period. Simply put, it gauges the momentum of price movements in relation to their typical range. Typically, CCI values oscillate between -100 and +100.
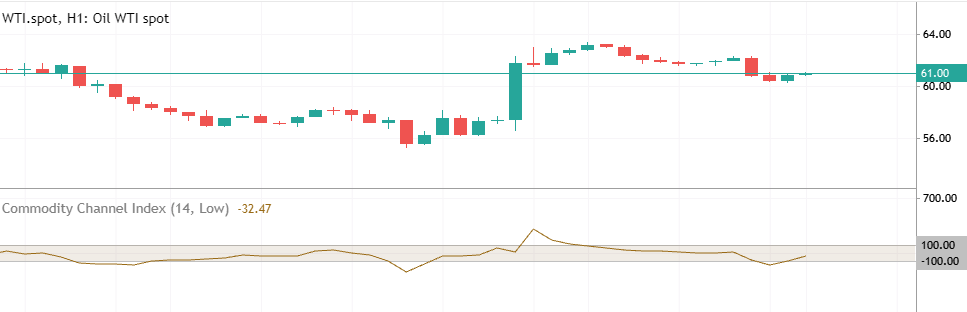
When the CCI moves above +100, it may indicate that the market is overbought or “overheated.” When it drops below -100, it may suggest the market is oversold. While these readings don’t guarantee an imminent trend reversal, they do highlight a potential shift in market sentiment. It’s important to remember: the CCI is not a prediction tool — it reflects probabilities, not certainties.
What Do CCI Signals Mean?
When analyzing the CCI, it’s essential to go beyond the numbers. Always consider market context, including trend direction, volatility, and recent candlestick behavior.
Key CCI signals:
- Crossing +100 from above – potential sell signal. The price may have reached a local top.
- Crossing -100 from below – potential buy signal. The asset may be entering an oversold zone.
- Divergence between price and CCI – a strong sign of weakening momentum. For example, if the price hits new highs but the CCI does not, this may indicate it’s time to take profits or reconsider the trade direction.
How to Configure the CCI for a Specific Market
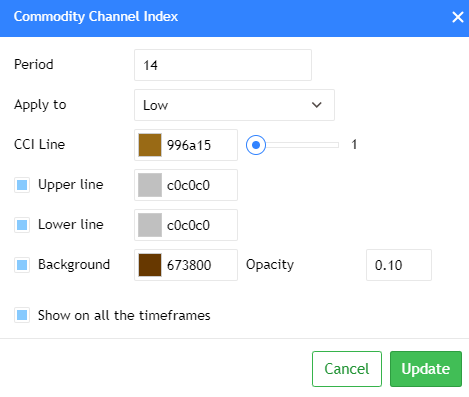
A critical parameter to understand with the CCI is its calculation period. While the default settings are frequently 14 or 20 periods, traders have the flexibility to adjust this value to align with their individual trading style and the specific characteristics of the market they are analyzing.
A shorter calculation period makes the CCI more reactive to price changes, leading to faster signals. However, this increased sensitivity can also result in a higher number of false signals. Conversely, a longer period smooths out price fluctuations, producing more “balanced” and potentially more reliable signals.
How to choose the right period:
- Review your asset’s chart over the past year.
- Measure the number of bars between two significant peaks or troughs.
- Divide that number by three — this gives you a custom period to try for the CCI.
This method helps align the indicator with the asset’s natural price cycles.

Trading Strategies Using the CCI
The CCI can be used on its own, but it becomes significantly more effective when combined with other indicators.
Simple Strategy: CCI + Moving Average
This setup uses:
- CCI with a 20-period setting
- Simple Moving Average (SMA) with a 100-period setting
Strategy:
- Buy when the price moves above the SMA and CCI exits the oversold zone
- Sell when the price drops below the SMA and the CCI crosses +100 from above
This strategy is well-suited for short-term trading, such as 15-minute or 5-minute charts.
Advanced Strategy: CCI + MACD + Parabolic SAR
Designed for longer timeframes (H4 and above), this strategy combines three indicators:
- CCI — identifies overbought/oversold conditions
- MACD — confirms trend direction
- Parabolic SAR — refines entry and exit points
Example of a sell signal:
- CCI drops below +100
- MACD crosses below its signal line
- Parabolic SAR dots appear above the price
Thanks to its clear rules, this system works well for beginners. Experienced traders can also appreciate its flexibility in managing risk. Keep in mind that these are just strategy examples. Always analyze the current market situation and the specific instrument thoroughly before trading.

Pros and Cons of the CCI
Advantages
- Versatile — applicable to any asset class
- User-friendly — signals are easy to interpret
- Highly compatible — works well with other indicators
Limitations
- Less reliable in sideways (flat) markets
- Lagging nature — like most oscillators, signals come after the fact
- False signals — can occur in highly volatile conditions
Given these considerations, professional traders frequently integrate the CCI as a confirmation tool to validate signals generated by other primary indicators or analysis techniques, rather than relying on it as a standalone signal source.

Tips for Novice Traders
If you’re just starting out with the CCI, keep these guidelines in mind:
- Start with standard settings: Begin by using the 14 or 20-period CCI. This will help you develop a solid understanding of its typical behavior.
- Integrate with other tools: Avoid relying solely on the CCI. Enhance your analysis by incorporating other indicators like MACD, moving averages, and Parabolic SAR for crucial confirmation.
- Always use stop-losses: Protect every trade with stop-loss orders. This vital risk management technique helps limit potential losses and reduces impulsive actions.
- Practice on a demo account first: Before engaging in live trading, thoroughly test your strategies and build confidence using virtual funds in a demo environment.
Conclusion
The Commodity Channel Index is more than just a supporting tool — it’s a powerful indicator that can sharpen your trading decisions when used effectively. On its own, the CCI provides valuable insights into momentum and potential market reversals. But when paired with other indicators and applied thoughtfully within the broader market context, it becomes a reliable ally in identifying high-probability setups.